Market Outlook
January 12, 2018
Market Cues
Domestic Indices
Chg (%)
(Pts)
(Close)
Indian markets are likely to open positive tracking global indices and SGX Nifty.
BSE Sensex
0.2
70
34,503
US stocks moved notably higher over the course of the trading day, more than
Nifty
0.2
19
10,651
offsetting the modest pullback seen in the previous session. With the upward move,
Mid Cap
0.3
50
18,168
the major averages climbed to new record closing highs. The Dow Jones jumped to
Small Cap
0.4
81
19,984
0.8% to close at 25,574 and the Nasdaq Composite edged up to 0.8%, to 7,211.
Bankex
(0.0)
(7)
28,952
U.K. shares were marginally higher as the pound weakened against the dollar and
euro, helping offset weak earnings updates from the likes of Tesco and Marks &
Global Indices
Chg (%)
(Pts)
(Close)
Spencer Group. The FTSE 100 was up by 0.2% to close at 7,762.
Dow Jones
(0.1)
(17)
25,369
Nasdaq
(0.1)
(10)
7,154
On domestic front, Indian shares rose on last trading session,
although markets ended off their day's highs ahead of earnings from TCS due out
FTSE
0.0
1
7,750
later in the day. The Sensex ended on an upside front of 0.2% at 34,503 while the
Nikkei
(0.3)
(78)
23,710
Nifty ended at 10,651 with an upside of 0.2%.
Hang Seng
0.2
47
31,120
Shanghai Com
0.1
4
3,425
News Analysis
Result preview: Infosys (CMP: `1,041/ TP: `1,120/ Upside: 7.6%)
Advances / Declines
BSE
NSE
Result Review: TCS (CMP: `2,788/ TP: `2,442/ Downside: 12.4%)
Advances
1,609
722
Detailed analysis on Pg2
Declines
1,352
1,071
Unchanged
132
56
Investor’s Ready Reckoner
Key Domestic & Global Indicators
Volumes (` Cr)
Stock Watch: Latest investment recommendations on 150+ stocks
BSE
5,254
Refer Pg5 onwards
NSE
35,271
Top Picks
CMP
Target
Upside
Company
Sector
Rating
(`)
(`)
(%)
Net Inflows (` Cr)
Net
Mtd
Ytd
Blue Star
Capital Goods Accumulate
796
867
9.0
FII
(22)
2,555
2,555
Dewan Housing Finance
Financials
Buy
617
712
15.4
*MFs
725
2,50,800 2,50,800
Asian Granito
Other
Accumulate
593
639
7.7
Navkar Corporation
Other
Buy
209
265
26.8
Top Gainers
Price (`)
Chg (%)
KEI Industries
Capital Goods
Buy
372
436
17.1
More Top Picks on Pg4
Idfcbank
69
8.3
Prajind
128
7.3
Key Upcoming Events
Symphony
2,145
7.2
Previous
Consensus
Date
Region
Event Description
Reading
Expectations
Erosmedia
254
7.1
Jan12
China
Exports YoY%
12.30
10.80
Aban
268
6.9
Jan12
India
Imports YoY%
19.60
Jan12
US
Consumer price index (mom)
0.40
0.10
Top Losers
Price (`)
Chg (%)
Jan15
India
Industrial Production YoY
2.20
4.30
Jan15
India
Exports YoY%
30.60
Fortis
149
(8.2)
More Events on Pg7
Videoind
24
(5.0)
Tatasponge
1,154
(3.7)
Concor
1,428
(2.9)
Alkem
2,283
(2.8)
As on January 10, 2018
Market Outlook
January 12, 2018
News Analysis
Result preview: Infosys (CMP: `1,041/ TP: `1,120/ Upside: 7.6%)
Infosys is slated to announce its 3QFY2017 results today. We expect the company
to post 1.0% sequential growth in USD revenues to US$2,755mn. In rupee terms,
revenues are expected to come in at `17,770cr, up 1.2% QoQ. EBITDA margin is
expected to show a downtick of ~7bp QoQ to 26.7%, while EBIT is expected to
have a downtick of 39bps QoQ. Consequently, PAT is expected to be at `3,587cr,
a dip of 3.7% QoQ. We maintain our accumulate rating on the stock, with a price
target of `1,120.
Y/E
Sales OPM
PAT
EPS ROE P/E P/BV EV/EBITDA EV/Sales
March
(` cr)
(%)
(` cr)
(`)
(%)
(x)
(x)
(x)
(x)
FY2017E
70,333
26.0
14,169
61.7
18.9
17.7
3.3
10.5
2.7
FY2018E
75,960
26.0
15,125
65.9
18.7
16.0
3.1
9.5
2.5
Result Review: TCS (CMP: `2,788/ TP: `2,442/ Downside: 12.4%)
TCS posted a 1.0% sequential growth in USD revenues to US$4,787mn V/s
US$4,801mn expected. In rupee terms, revenues came in at `30,904cr V/s
`31,049cr, up 1.2% QoQ. On Constant Currency (CC) terms, the company
posted a 1.3% QoQ growth with volume growth coming in at 1.6% QoQ growth
(highest growth in since three years for the December quarter).
In terms of the geography, USA was key driver, with North America & Latin
America registering a QoQ CC growth of 1.5% and 5.0% respectively. In Europe,
it was Continental Europe registering a QoQ CC growth of 2.6%. In terms of the
Industries, it was Retail & CPG, registering a QoQ CC growth of 6.4%, while
Energy & Utilities posted a QoQ CC growth of 8.5%, Life Sciences & Healthcare
(QoQ CC growth of 2.5%).
On profitability front, EBIT margin showed an upside of ~12bp QoQ to 25.2%.
Consequently, PAT came in at 6,531cr V/s `6,509cr expected, up of 1.1% QoQ.
In terms of Client additions, in $50M+ it added 3; $20M+7, $10M+ 9, & in
$5M+ 15. In services Digital (which posted a QoQ CC growth of 13.9%), the
company signed the largest digital deal signed till date. In terms of attrition, it
came in at 11.9%. We maintain our reduce rating on the stock, with a price target
of `2,442.
Y/E
Sales OPM
PAT
EPS ROE P/E P/BV EV/EBITDA EV/Sales
March
(` cr)
(%)
(` cr)
(`)
(%)
(x)
(x)
(x)
(x)
FY2018E
1,23,384
26.1
26,063
133.2
27.6
20.9
5.8
15.4
4.0
FY2019E
1,34,488
26.1
28,116
143.7
27.8
19.4
5.4
13.9
3.6
Market Outlook
January 12, 2018
Economic and Political News
Retail inflation likely to hit 17-month high of 5.1% in December
Govt to extend Urja Ganga gas pipeline project to North Eastern states
Income Tax dept attaches 900 benami properties worth over Rs 35 billion
Corporate News
Patanjali Ayurved looking for foreign venture funds, says official
UIDAI allows Airtel to do Aadhaar-based eKYC verification till March 31
Department of telecom aims to clear Trai suggestions by March 31
Tata Consultancy Services posts 1.3% rise in Q3 net profit at Rs 65.31bn
Reliance Infrastructure likely to win NTPC's EPC project worth Rs 5.67bn
Quarterly Bloomberg Brokers Consensus Estimate
Infosys Ltd - Jan 12, 2018
Particulars ( ` cr)
3QFY18E
3QFY17
y-o-y (%)
2QFY18
q-o-q (%)
Sales
17,842
17,273
3.3
17,657
1.1
EBIDTA
4,729
4,767
(0.8)
4,702
0.5
%
26.5
27.6
26.7
PAT
3,693
3,708
(0.4)
3,726
(0.8)
GAIL - Jan 15, 2018
Particulars ( ` cr)
3QFY18E
3QFY17
y-o-y (%)
2QFY18
q-o-q (%)
Sales
14,007
12,132
15.5
12,409
12.8
EBIDTA
2,162
1,726
25.2
2,069
4.5
%
15.4
14.2
16.6
PAT
1,314
982
33.8
1,309
0.4
Market Outlook
January 12, 2018
Top Picks HHHHH
Market Cap
CMP
Target
Upside
Company
Rationale
(` Cr)
(`)
(`)
(%)
Strong growth in domestic business due to its leade`hip
in acute therapeutic segment. Alkem expects to launch
Alkem Laboratories
27,294
2,283
2,441
6.9
more products in USA, which bodes for its international
business.
We expect the company would report strong profitability
Asian Granito
1,785
593
639
7.7
owing to better product mix, higher B2C sales and
amalgamation synergy.
Favorable outlook for the AC industry to augur well for
Cooling products business which is out pacing the
Blue Star
7,630
796
867
9.0
market growth. EMPPAC division's profitability to
improve once operating environment turns around.
With a focus on the low and medium income (LMI)
consumer segment, the company has increased its
Dewan Housing Finance
19,353
617
712
15.4
presence in tier-II & III cities where the growth
opportunity is immense.
Loan growth is likely to pick up after a sluggish FY17.
Lower credit cost will help in strong bottom-line growth.
Karur Vysya Bank
8,883
123
160
30.0
Increasing share of CASA will help in NIM
improvement.
High order book execution in EPC segment, rising B2C
KEI Industries
2,917
372
436
17.1
sales and higher exports to boost the revenues and
profitability
Expected to benefit from the lower capex requirement
Music Broadcast
2,360
414
475
14.8
and 15 year long radio broadcast licensing.
Massive capacity expansion along with rail advantage
Navkar Corporation
3,146
209
265
26.8
at ICD as well CFS augur well for the company
Strong brands and distribution network would boost
Siyaram Silk Mills
3,579
764
813
6.5
growth going ahead. Stock currently trades at an
inexpensive valuation.
Market leadership in Hindi news genre and no.
2
viewership ranking in English news genre, exit from the
TV Today Network
2,750
461
500
8.5
radio business, and anticipated growth in ad spends by
corporate to benefit the stock.
After GST, the company is expected to see higher
volumes along with improving product mix. The Gujarat
Maruti Suzuki
2,82,188
9,342
10,619
13.7
plant will also enable higher operating leverage which
will be margin accretive.
We expect loan book to grow at 24.3% over next two
GIC Housing
2,502
465
655
41.0
year; change in borrowing mix will help in NIM
improvement
We expect CPIL to report net Revenue/PAT CAGR of
~17%/16% over FY2017-20E mainly due to healthy
7,878
355
400
12.8
growth in plywood & lamination business, forayed into
Century Plyboards India
MDF & Particle boards on back of strong brand &
distribution network.
We expect sales/PAT to grow at 13.5%/20% over next
LT Foods
3,309
103
128
23.7
two years on the back of strong distribution network &
addition of new products in portfolio.
We expect sales/PAT to grow at 13%/16% over next two
years on the back of strong healthy demand in writing
Ruchira Papers
469
209
244
16.8
& printing paper and Kraft paper. Further, China had
banned making paper from waste pulp which would
benefit Indian paper companies.
Source: Company, Angel Research
Market Outlook
January 12, 2018
Key Upcoming Events
Result Calendar
D ate
C ompany
January 12, 2018
Infosys, GAIL
January 15, 2018
Federal Bank
Source: Bloomberg, Angel Research
Global economic events release calendar
Bl oomberg Data
D ate
Time
C ountry
Event Description
Unit
Period
L ast Reporte d
E stimate d
Jan 12, 2018
China
Exports YoY%
% Change
Dec
12.30
10.80
India
Imports YoY%
% Change
Dec
19.60
7:00 PMUS
Consumer price index (mom)
% Change
Dec
0.40
0.10
Jan 15, 2018
5:30 PMIndia
Industrial Production YoY
% Change
Nov
2.20
4.30
India
Exports YoY%
% Change
Dec
30.60
12: 00 PMIndia
Monthly Wholesale Prices YoY%
% Change
Dec
3.93
4.00
Jan 16, 2018
3:00 PMUK
CPI (YoY)
% Change
Dec
3.10
Jan 17, 2018
3:30 PMEuro Zone Euro-Zone CPI (YoY)
%
Dec F
1.40
7:45 PMUS
Industrial Production
%
Dec
0.20
0.20
Jan 18, 2018
7:00 PMUS
Housi ng Starts
Thousands
Dec
1,297.00
1,270.00
7:00 PMUS
Building permits
Thousands
Dec
1,303.00
1,290.00
7:30 AMChina
Industrial Production (YoY)
% Change
Dec
6.10
6.10
7:30 AMChina
Real GDP (YoY)
% Change
4Q
6.80
6.70
Jan 24, 2018
2:00 PMGermany PMI Manufacturing
Value
Jan P
63.30
2:00 PMGermany PMI Services
Value
Jan P
55.80
Source: Bloomberg, Angel Research
Market Outlook
January 12, 2018
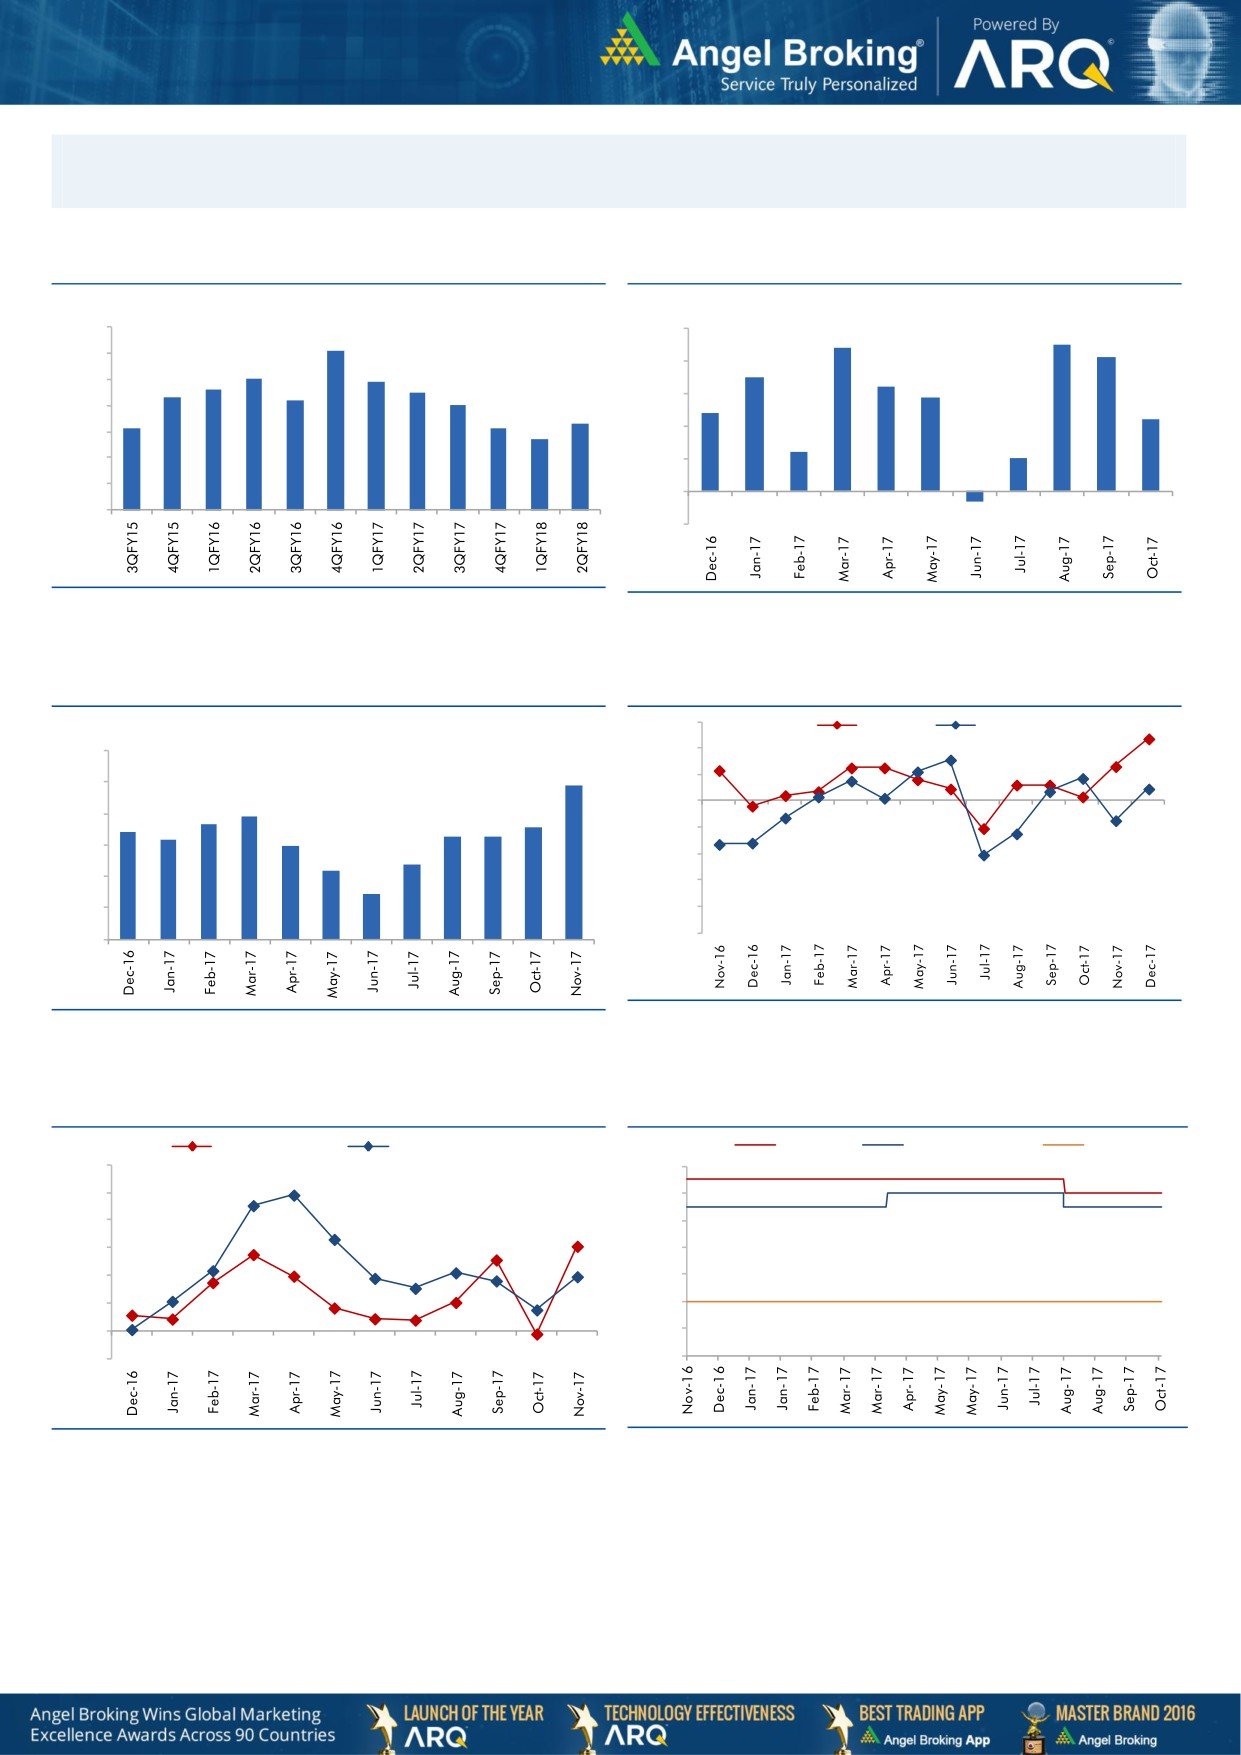
Macro watch
Exhibit 1: Quarterly GDP trends
Exhibit 2: IIP trends
(%)
(%)
10.0
5.0
4.5
9.1
4.4
4.1
9.0
8.0
7.9
4.0
3.5
7.6
7.5
3.2
8.0
7.3
7.2
2.9
7.0
3.0
2.4
7.0
6.3
2.2
6.1
6.1
5.7
2.0
6.0
1.2
1.0
5.0
1.0
4.0
-
3.0
(1.0)
(0.3)
Source: CSO, Angel Research
Source: MOSPI, Angel Research
Exhibit 3: Monthly CPI inflation trends
Exhibit 4: Manufacturing and services PMI
56.0
Mfg. PMI
Services PMI
(%)
6.0
54.0
4.9
52.0
5.0
3.9
50.0
4.0
3.7
3.6
3.4
3.3
3.3
3.2
3.0
48.0
3.0
2.4
2.2
46.0
2.0
1.5
44.0
1.0
42.0
40.0
-
Source: Market, Angel Research; Note: Level above 50 indicates expansion
Source: MOSPI, Angel Research
Exhibit 5: Exports and imports growth trends
Exhibit 6: Key policy rates
(%)
Exports yoy growth
Imports yoy growth
(%)
Repo rate
Reverse Repo rate
CRR
60.0
6.50
50.0
6.00
40.0
5.50
30.0
5.00
20.0
4.50
10.0
4.00
0.0
3.50
(10.0)
3.00
Source: Bloomberg, Angel Research
Source: RBI, Angel Research
Market Outlook
January 12, 2018
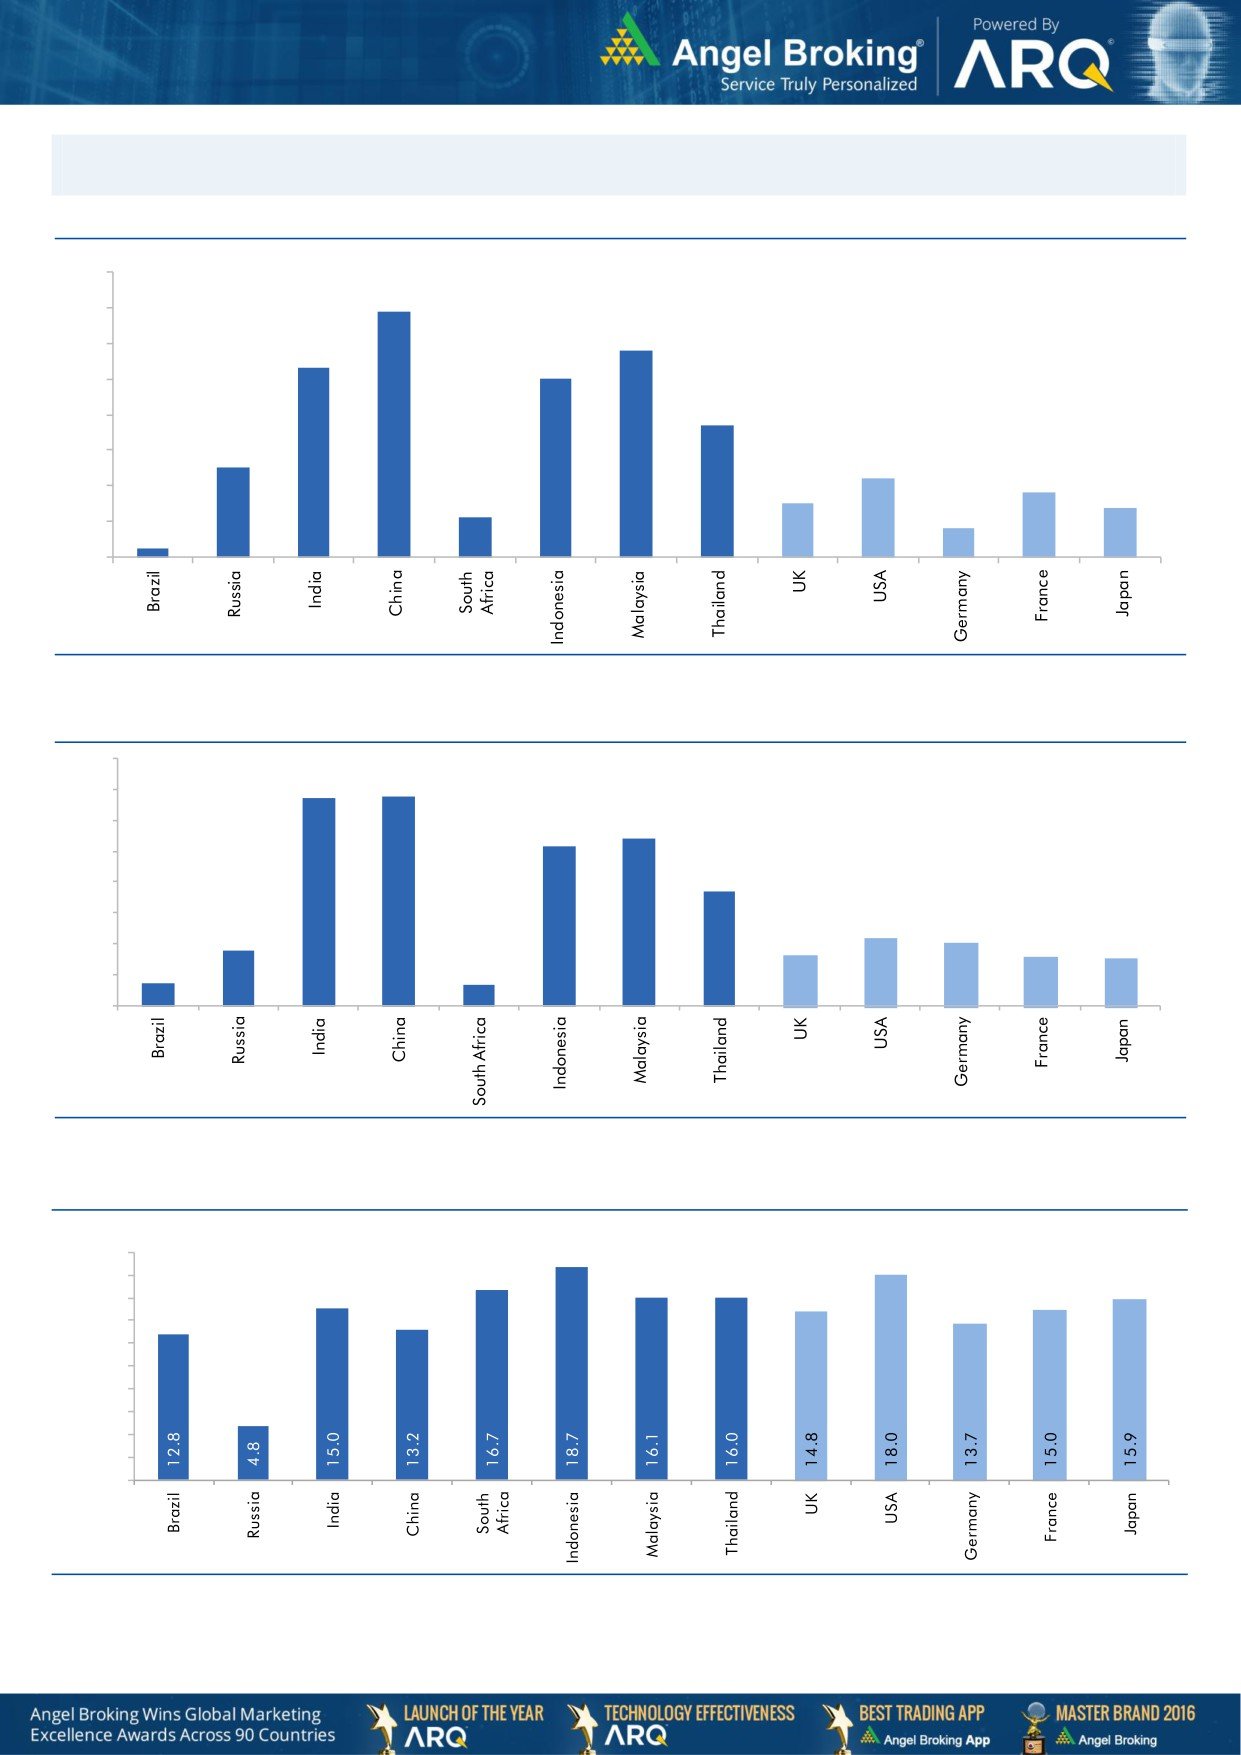
Global watch
Exhibit 1: Latest quarterly GDP Growth (%, yoy) across select developing and developed countries
(%)
8.0
6.9
7.0
5.8
6.0
5.3
5.0
5.0
1.1
3.7
4.0
2.5
3.0
2.2
1.8
2.0
1.5
1.4
0.8
1.0
0.3
-
Source: Bloomberg, Angel Research
Exhibit 2: 2017 GDP Growth projection by IMF (%, yoy) across select developing and developed countries
(%)
6.7
6.8
7.0
6.0
5.4
5.2
5.0
3.7
4.0
3.0
1.8
2.2
2.0
1.7
1.6
2.0
0.7
1.5
0.7
1.0
-
Source: IMF, Angel Research
Exhibit 3: One year forward P-E ratio across select developing and developed countries
(x)
20.0
18.0
16.0
14.0
12.0
10.0
8.0
6.0
4.0
2.0
-
Source: IMF, Angel Research
Market Outlook
January 12, 2018
Exhibit 4: Relative performance of indices across globe
Returns (%)
C ountry
Name of index
Closing price
1M
3M
1YR
Brazil
Bovespa
78,201
6.7
1.9
26.5
Russia
Micex
2,232
6.6
7.0
1.1
India
Nifty
10,632
3.2
6.7
29.3
China
Shanghai Composite
3,422
3.1
1.2
9.2
South Africa
Top 40
53,168
2.1
2.7
17.2
Mexico
Mexbol
48,785
3.9
(3.4)
6.3
Indonesia
LQ45
1,082
7.1
10.0
30.2
Malaysia
KLCI
1,823
6.0
3.3
11.0
Thailand
SET 50
1,165
6.6
8.7
21.3
USA
Dow Jones
25,369
4.8
11.5
27.1
UK
FTSE
7,749
5.5
3.2
6.3
Japan
Nikkei
23,788
5.2
15.4
24.5
Germany
DAX
13,281
1.6
2.2
15.1
France
CAC
5,505
2.2
2.6
13.3
Source: Bloomberg, Angel Research p68in4
Market Outlook
January 12, 2018
Research Team Tel: 022 - 39357800
DISCLAIMER
Angel Broking Private Limited (hereinafter referred to as “Angel”) is a registered Member of National Stock Exchange of India
Limited,Bombay Stock Exchange Limited and Metropolitan Stock Exchange Limited. It is also registered as a Depository Participant with
CDSL and Portfolio Manager with SEBI. It also has registration with AMFI as a Mutual Fund Distributor. Angel Broking Private Limited is a
registered entity with SEBI for Research Analyst in terms of SEBI (Research Analyst) Regulations, 2014 vide registration number
INH000000164. Angel or its associates has not been debarred/ suspended by SEBI or any other regulatory authority for accessing
/dealing in securities Market. Angel or its associates/analyst has not received any compensation / managed or
co-managed public offering of securities of the company covered by Analyst during the past twelve months.
This document is solely for the personal information of the recipient, and must not be singularly used as the basis of any investment
decision. Nothing in this document should be construed as investment or financial advice. Each recipient of this document should make
such investigations as they deem necessary to arrive at an independent evaluation of an investment in the securities of the companies
referred to in this document (including the merits and risks involved), and should consult their own advisors to determine the merits and
risks of such an investment.
Reports based on technical and derivative analysis center on studying charts of a stock's price movement, outstanding positions and
trading volume, as opposed to focusing on a company's fundamentals and, as such, may not match with a report on a company's
fundamentals. Investors are advised to refer the Fundamental and Technical Research Reports available on our website to evaluate the
contrary view, if any.
The information in this document has been printed on the basis of publicly available information, internal data and other reliable
sources believed to be true, but we do not represent that it is accurate or complete and it should not be relied on as such, as this
document is for general guidance only. Angel Broking Pvt. Limited or any of its affiliates/ group companies shall not be in any way
responsible for any loss or damage that may arise to any person from any inadvertent error in the information contained in this report.
Angel Broking Pvt. Limited has not independently verified all the information contained within this document. Accordingly, we cannot
testify, nor make any representation or warranty, express or implied, to the accuracy, contents or data contained within this document.
While Angel Broking Pvt. Limited endeavors to update on a reasonable basis the information discussed in this material, there may be
regulatory, compliance, or other reasons that prevent us from doing so.
This document is being supplied to you solely for your information, and its contents, information or data may not be reproduced,
redistributed or passed on, directly or indirectly.
Neither Angel Broking Pvt. Limited, nor its directors, employees or affiliates shall be liable for any loss or damage that may arise from
or in connection with the use of this information.